We have often described how Sherpa Funds Technology helps Portfolio Managers generate better returns from their asset selection and convictions, and we have gone into some detail about how we do this, and what the Sherpa process involves.
So now let’s look at the effect that Sherpa’s process has on your portfolios. Where do you see the difference and when does it happen?
One way to answer this look at this is to take real data from clients and show the differences in returns between the portfolios Sherpa constructs and those constructed without the Sherpa process.
We have often showed cumulative P&L graphs like the one below:
Over the period Aug 2018 to April 2022, the PM’s portfolio construction on its own returned a total of 21% relative to benchmark, and the Portfolio as constructed by Sherpa returned 39%.
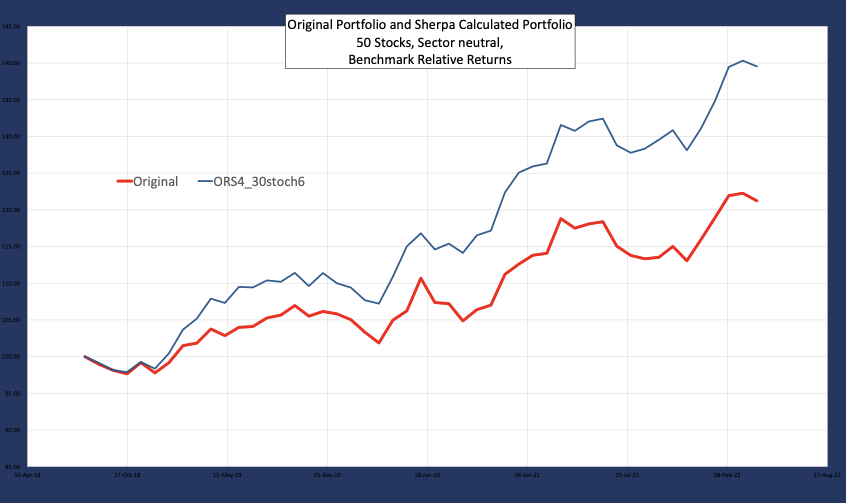
This is a 50-60 stock portfolio of US large caps, benchmarked to SnP500, managing 3bn USD, rebalanced monthly.
And you can see that the Sherpa portfolio has consistently outperformed the portfolio that the manager constructed without Sherpa’s help.
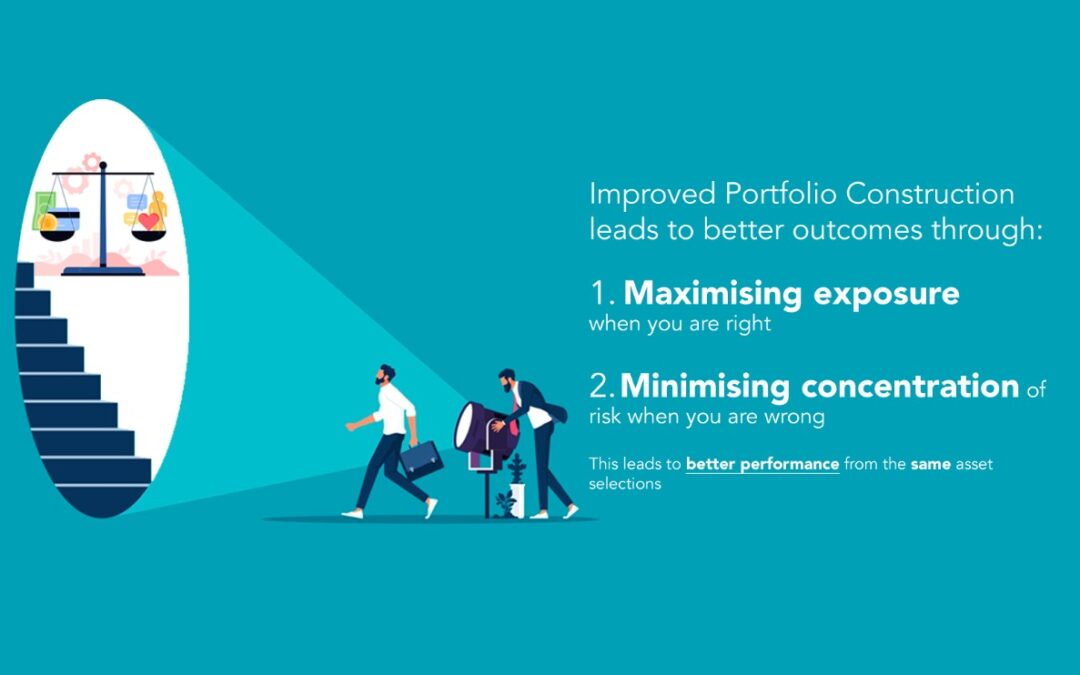
Now to understand this better, we can think about what Sherpa sets out to do, and when you’d expect to see the effects and what those effects are.
And to help that, let’s consider one of our mottos:
‘More of the Risk You Want, Less of the risk you don’t want’
And break that down.
1: “More of the risk you want”
The PM and their team make asset selections and will have conviction or target prices for those assets. They want the exposure to those decisions; this is this is the risk they want.
For example, a portfolio may have 50 assets, and the PM (as this one does) may use a 1-4 scoring system, with the assets ranked 4 being the highest conviction, and the 1’s being lowest.
Therefore, when we say ‘more of the risk you want’ what we really want is higher risk exposure to the 4’s, while not increasing overall portfolio risk.
Please note, I say ‘risk exposure’ rather than asset weight: the two are linked, but it is really risk contribution rather than simple asset weight that we are concerned about, but for simplicity in this article we’ll use weight as a proxy.
And that’s the first thing that a Sherpa portfolio delivers: a portfolio that has more exposure to your high conviction ideas, for the same level of volatility.
In this case, over the 14 months, the Original Portfolio had an average of 35% of the fund invested in the highest (that is those that score 4) conviction assets and the Sherpa portfolio has an average of 47% invested in the 4’s.
So that means that when you are right you will perform even better with a Sherpa assisted portfolio.
BUT you don’t have any more overall risk.
The volatility of the Sherpa Portfolio is almost exactly the same as the original portfolio: (12.5% vs 12.4%)
And over the time the Sherpa portfolio had lower drawdown: peak to trough was -3.8% vs -5.5% in the original.
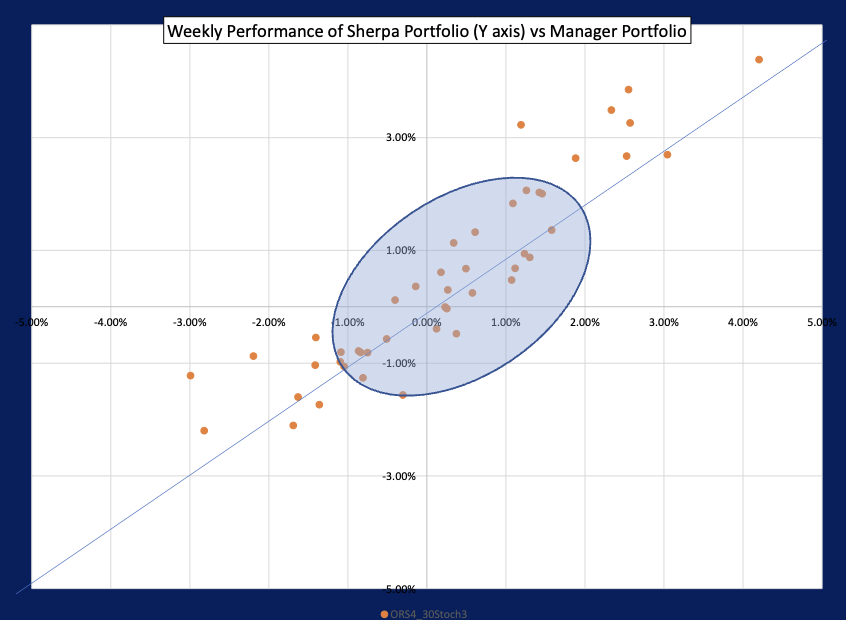
Let’s look then at when the outperformance is realised:
If we plot the returns of the 2 portfolios (Manager on X axis, Sherpa on Y) for each period that makes up the cumulative graph above, we can see this clearly in the top right-hand side.
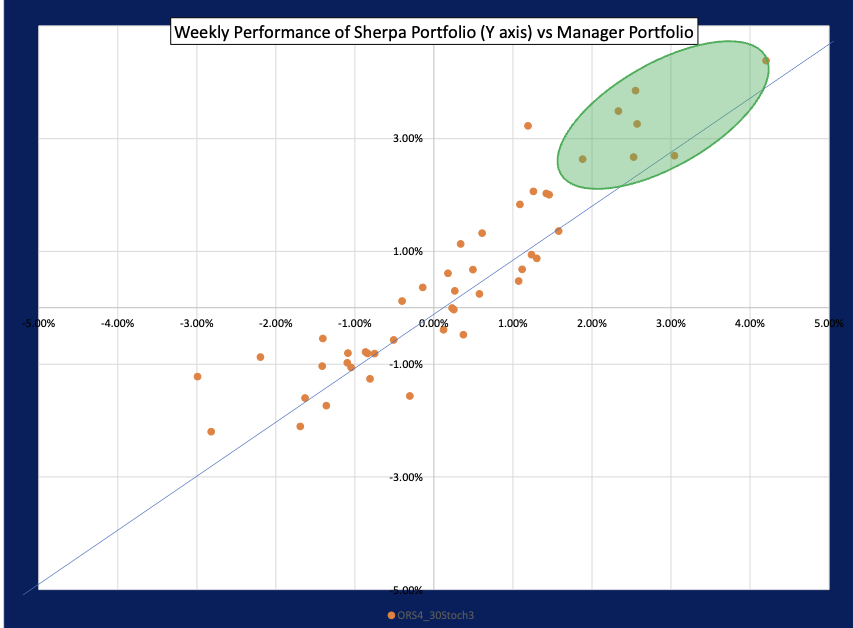
Each dot represents a return for a period, in this case it is for a week. The position on the X axis is the returns of the original portfolio, and the Y axis is the return of the Sherpa constructed portfolio.
Any given week where the dot lies above the Y=X line, is a week that Sherpa outperformed the Original, and vice-versa.
The first observation is that Sherpa delivers ‘more of the risk you want’
I.E., when the manager is correct, the 4’s perform well, the manager’s portfolio performs well, and the Sherpa one performs even better. This is the shaded green area on the graph above. When the Manger gets the asset selection right, the Sherpa portfolio outperforms because, for the same total risk, Sherpa gives you more exposure to your ideas. You experience higher volatility and higher returns when you are right.
The next point is ‘Less of the Risk you don’t want’
Now recall we are saying that we want overall volatility to remain the same, so that means that there is less volatility when you are wrong, that is when your selection underperforms the benchmark either because of asset specific moves, or when other macro or style factors come into play.
You can see that in the left-hand side of the graph: when your asset selection doesn’t work out, you lose money (relative to the benchmark in this case), and the Sherpa portfolio loses less money, the Sherpa portfolio is less volatile during periods of drawdown.
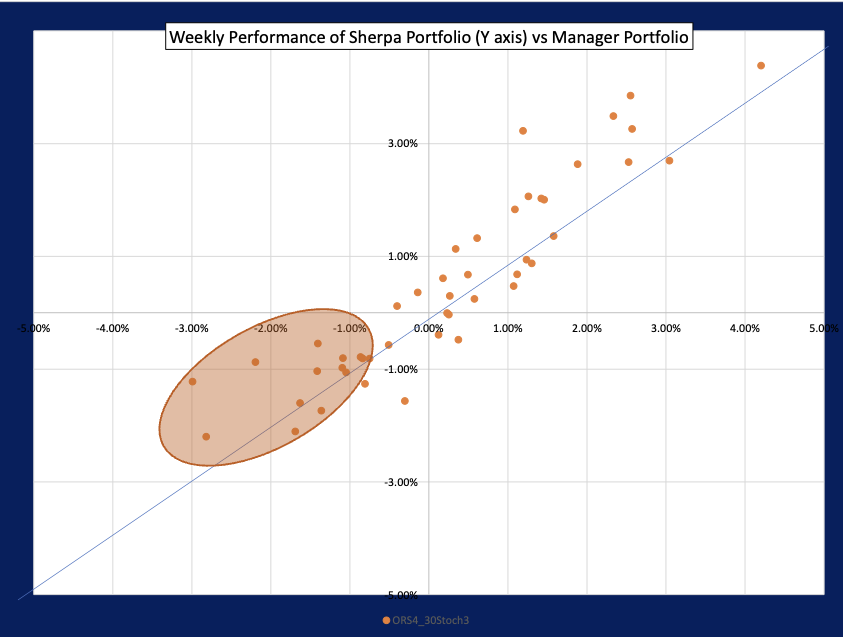
Finally, during periods of small positive or negative returns you can see that the Sherpa portfolio and the managers perform about the same, in some periods the Sherpa portfolio underperforms, and in some it outperforms.
This gives us a way of thinking about how to construct a portfolio: let’s think about the return of our portfolio broken down into different sets of periods:
- The set of periods when your investment thesis works and you do very well
- The set of periods when your thesis is doing badly
- The set of periods when the portfolio P&L is effectively noise
And that allows us to frame our portfolio construction problem in these terms:
When we do well with our asset selection, we want the most return, so the highest exposure to our views, we want to maximise upside volatility.
When we do badly, we want as much diversification as possible, so the portfolio should be constructed to minimize downside volatility, this means we must penalize the weights of assets that move down in-step with each other.
And when there is no real signal in the market our ups and downs should not have a bias one way or the other.
Is this really possible? Can you get better returns when you are right? Less negative returns when you’re wrong with no increase in overall volatility?
In a word ‘Yes”, and in other posts here & here we have talked about the way that we at Sherpa do this.
It is a process rather than a simple ‘plug ‘n play’ tool and it requires the PM and their team to spend some time thinking about what portfolio risk means to them and defining ‘the Risk they Want’ vs ‘the Risk they Don’t want’. It doesn’t need huge infrastructure changes, but Sherpa clients certainly work better with the infrastructure that they currently have.
And as result Sherpa’s clients, who run multi-billion funds in the US, EU and Asia, make better use of their analysis, run better process and get better returns.