Delivering The Long/Short Equity Portfolio Your Investors Want
Summary: The equity long/short space is a very large but extremely competitive portion of the hedge fund universe. Different long/short equity portfolio strategies such as long-bias or pure market-neutral promise very different risk experiences for allocators. Fund managers that thrive in equity/long short portfolio management construct portfolios that both express the alpha in their proprietary research process while also delivering the risk profile their investors have signed up for. Managers need to consider the TYPE, RANGE and LEVEL of risk they want to deliver in their portfolio and ensure their resulting portfolio construction is consistent with those goals to give investors what they want.
Watch the related webinar at the link.
Deliver the Risk Your Investors Want in Long/Short Equity
Equity long/short is a competitive space which experienced highly publicized outflows in recent years.
Yet equity long/short and similar long-bias strategies remain some of the largest hedge fund categories by AUM. Despite high-profile withdrawals and closures, allocators still actively invest in a wide range of these strategies.
To meet investor needs and retain their mandate in this environment, equity hedge fund managers need to consistently transform their unique stock selection alpha into a portfolio that delivers the risk their investors want from their strategy.
In this post we will show how modifying portfolio risk objectives during the portfolio construction process helps create portfolios that express the PM’s selection alpha while delivering the risk characteristics the fund’s investors want.
Equity long/short strategies are built on a common bedrock of stock selection alpha. The fund manager seeks to offset long positions in undervalued stocks with short positions in overvalued stocks to mitigate risk.
Many equity L/S managers may have alpha in their selections. However, capturing that alpha with the appropriate TYPES and LEVELS of risk mitigation is key to delivering the right investable risk product.
Let us look at what this entails in some common equity hedge fund strategies.
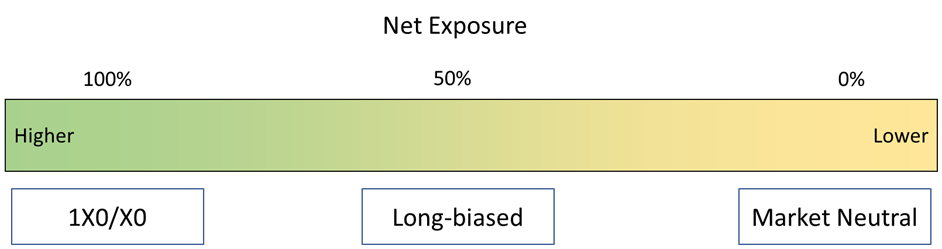
Long/Short Equity Portfolios Vary a LOT in their Objectives
While there are many variations and details, let us consider a few well-known equity hedge fund strategies in simplified terms.
- 1X0/X0 strategies retain full market risk and generally look to outperform an index
- Long-biased strategies participate in some market risk but with more downside protection
- Market Neutral strategies minimize market risk to isolate factor or stock specific risk
It should be clear that each of these strategies should deliver quite different risk!
Which Risk Levers Matter to Your Strategy?
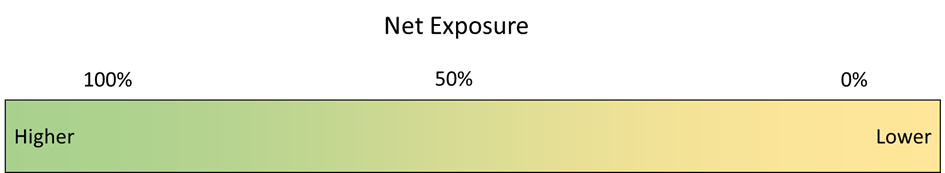
While the gradient shows each strategy’s net market exposure, this is just the first level of many different “risk levers” for a given portfolio. Drilling down, we can broadly consider:
- Net Exposure Level
- Market Beta Risk
- Style Factors
- Macro Risks
Some funds have greater sensitivity to style or macro risk factors, but all funds should have some awareness of their net exposure and market beta risk.
A specific risk attribution will “explain” a fund in terms of how much stock-specific risk is left over after accounting for these risk levers.
To illustrate further let us focus on net exposure as an example.
Each of the strategies above occupies a different location on this net exposure spectrum. A 130/30 fund for instance sits around 100% net exposure while a market neutral fund sits around net 0%.
Core Considerations to Define the Risk You Want
From here we can see there are three core considerations for a PM to deliver the risk their investors (and boss!) want from their portfolio.
- What TYPE risk is your investor paying you to deliver? = Which lever(s) are you looking at?
- What RANGE of that risk does your investor want? = Which box do you need to be in?
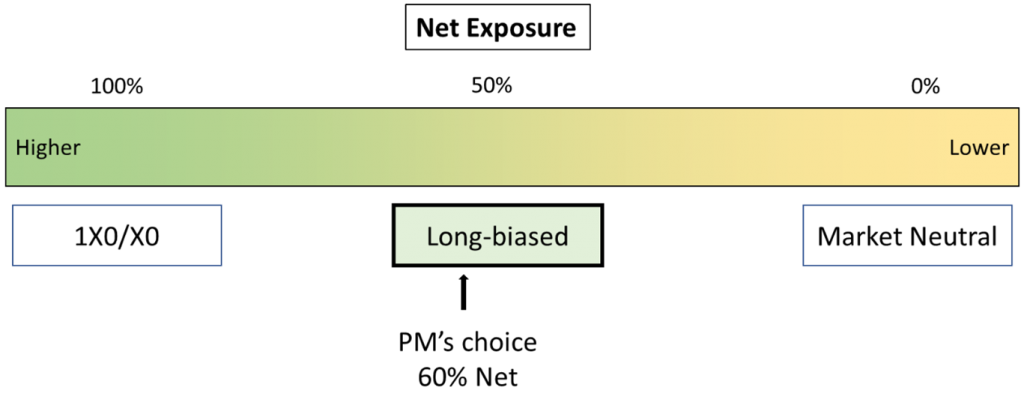
- What LEVEL of that risk do you as a PM want? = Where in the box is your portfolio?
The first two elements are largely defined by the fund’s offering documents and are essentially constraints on the portfolio by strategy. The third element – the exact LEVEL of that type of risk – the PM often has some control over.
If a sample long-bias fund can have anywhere between 30% and 70% net long exposure, at any point in the time the PM could choose a specific level. Say 60% as illustrated below.
Use Your Alpha to Deliver the Right Long/Short Equity Risk
Understanding this, fund managers can leverage their unique stock selection alpha to deliver a wide range of risk profiles.
Identifying the appropriate “risk levers” lets the PM create different portfolios to meet different investor wants from the same set of underlying stock selections.
Some fund managers do just this by offering both market-neutral and long-bias funds from the same pool of analysts and PMs.
Systematic portfolio construction techniques help a PM further fine-tune their portfolio to deliver the risk their investors want AND the risk the PM wants. Lets look at a few possible long/short equity portfolio constructions built from the same alpha to see these ideas in practice.
Possible Long/Short Equity Portfolio Construction Examples
Let us look at how the same set of stock selections can be shaped into a wide variety of different portfolios to meet different investor requirements. We will use an AI-driven stock signal Sherpa has implemented live for institutional and hedge fund clients.
A.I. Stock Selection Alpha Characteristics
- Universe: 700 most liquid US Stocks from Russell 1000 (US equities)
- Signal: Active long/short signals are eligible; Neutral names are not included
- Alpha Score: Included stocks are then scored via proprietary methodology
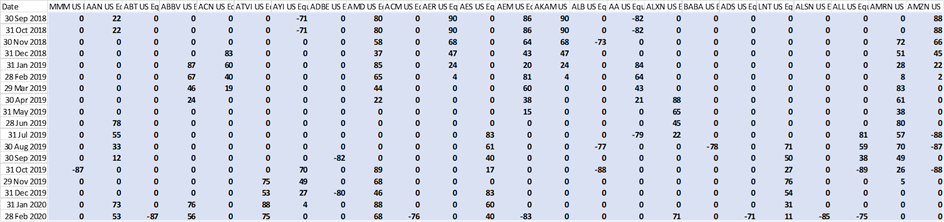
What Does this Alpha Actually Look Like?
For each stock in the universe, we have an alpha score for that stock at each point in time. This is like an analyst’s rating or PM’s conviction score.
In this example we can see names that have:
- Positive scores from Sep 2018 – Feb 2019 = eligible long
- Score of 0 from Mar 2019 – Jun 2019 = excluded from the portfolio
- Negative scores in Jul, Aug, Oct 2019 = eligible short
What Portfolios can we Create from This Set of Stocks?
With our list of eligible longs and shorts, we can construct a set of portfolios that comply with different strategy mandates.
While there are many more details in setting up the problem, for this case we have simplified to:
- How much exposure to market risk do we want in the portfolio?
- How much exposure to factor risk is acceptable in the portfolio?
Then after we look at those questions, we’ll also show that the PM can ask:
- How much risk am I comfortable taking?
- How should I best express the alpha view and risk view?
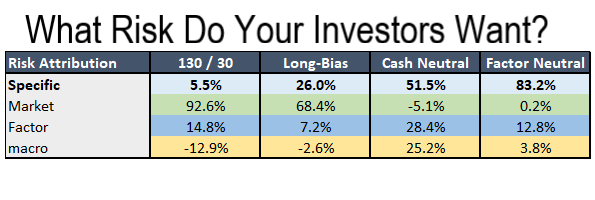
4 Different Strategies to Deliver 4 Different Types of Risk
The four strategies we created from the stock signal above are as follows:
- 130 / 30 aims to beat the SPX through superior stock picking with similar risk as the market
- Long-biased aims to capture the upside of our alpha source while limiting SPX downside
- Market-neutral (Cash Neutral) aims to provide an approximately 0% net exposure to provide uncorrelated access to the alpha in our stock picks
- Market-neutral (Factor Neutral) also aims to provide 0% net exposure but while constructing the portfolio to minimize residual factor and macro risks and maximize stock-specific risk
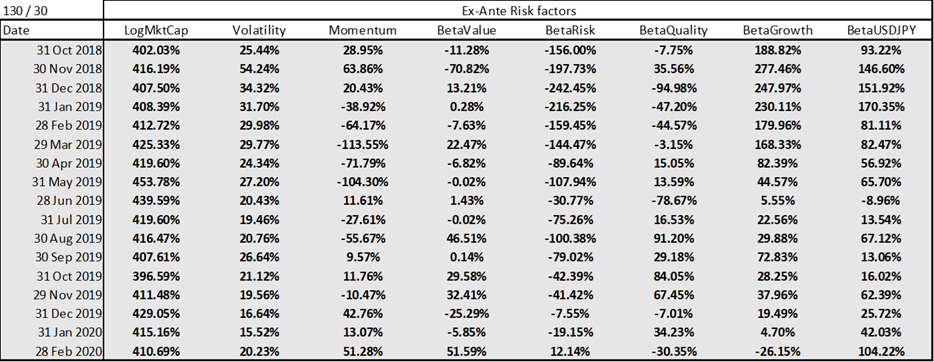
Lets look at the approximate “shape” of these four portfolios in terms of their net / gross market exposure and ex-ante Factor Risk exposures
130 / 30 = Full Exposure and Unconstrained Factors
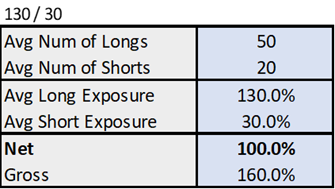
The 130/30 portfolio is 100% net long as specified and as we can see here retains quite a bit of residual factor risk.
Long-Biased = Hedged Market Risk While Delivering Alpha
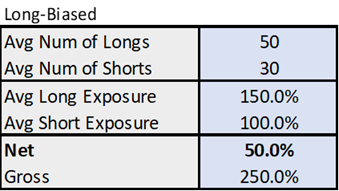
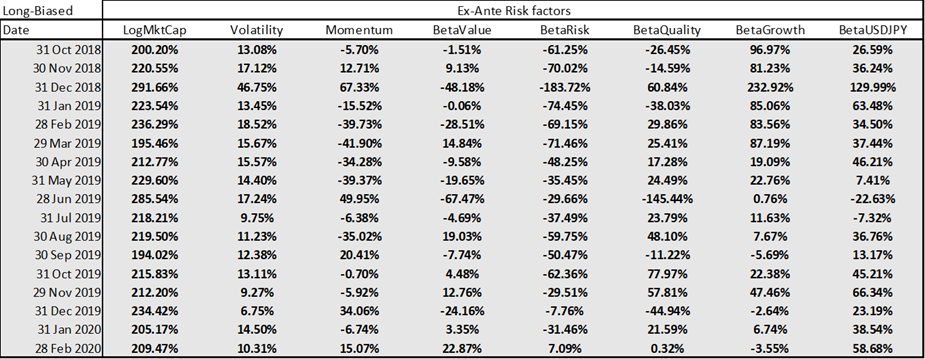
The long-biased portfolio retains only 50% net long exposure by adding a few more short positions. While it has less Factor Risk than the 130/30, these residuals risks remain substantial.
Cash Neutral = Net 0% with Residual Factors
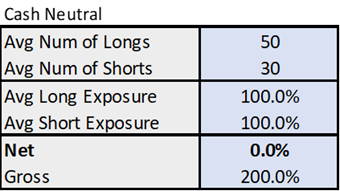
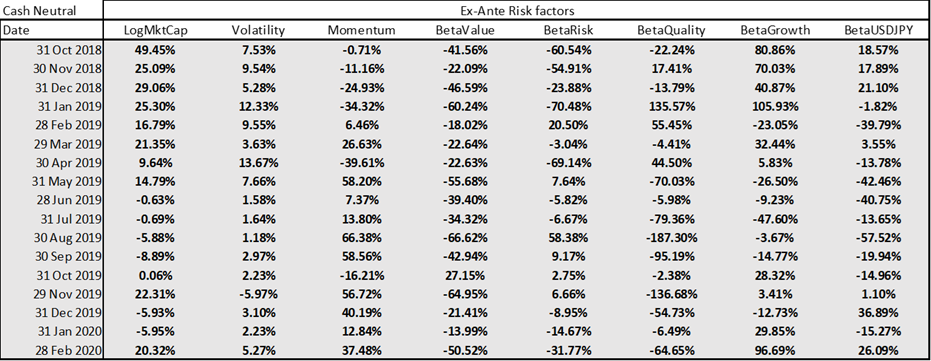
The Cash Neutral portfolio most closely resembles what we see from new long/short market neutral managers when they first start to work with Sherpa. The portfolio itself is net 0% but in any given period the portfolio likely exhibits meaningful residual factor bets.
Factor Neutral = Neutralised Market AND Factor Risks

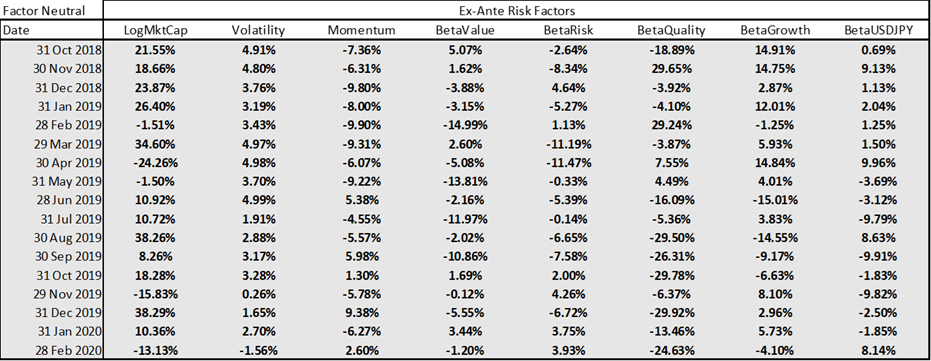
Finally, the Factor Neutral portfolio gives both a net 0% exposure with minimized residual risks, allowing idiosyncratic stock risk more room to drive our results.
Ex-Ante Long/Short Equity Portfolios Look Very Different
Looking at how all 4 portfolios are constructed we can see:
- Similar numbers of stocks used in each portfolio from the same alpha list BUT
- Net exposures in line with our strategy mandates,
- Vastly different ex-ante risk factor exposures between portfolios, and
- Widely varying ex-ante risk factor exposures within each portfolio period to period, EXCEPT when the factor risks are controlled.
But if we look at the ex-post results, what risks do these portfolios deliver and how does that translate into performance?
To illustrate how the ex-ante construction decisions translate into ex-post results, lets look at a basic risk attribution and historical summary for each portfolio.
130 / 30 Delivered Market Risk and Returns Shaped like SPX
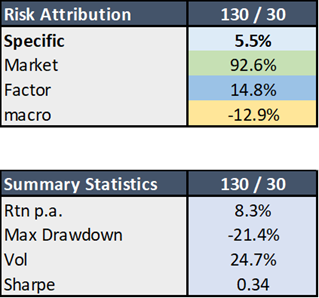
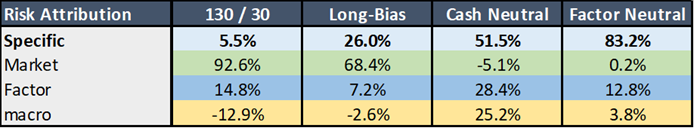
Our Risk Attribution shows that the 130/30 portfolio is overwhelmingly driven by market risk – which we should expect given the portfolio is net 100% long!
This portfolio offers only 5.5% specific risk.
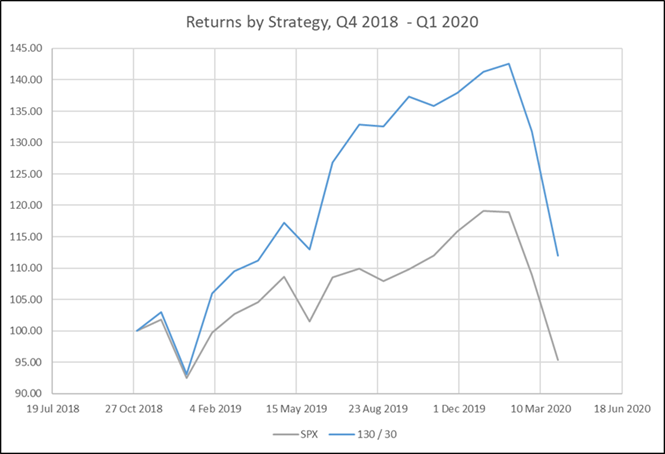
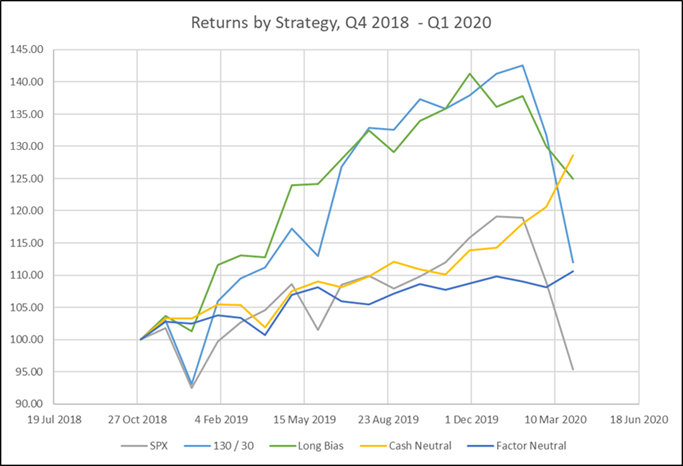
The shape of the returns also very closely resemble the SPX in the chart below while exhibiting equity-like levels of volatility and drawdown.
The 130/30 portfolio does beat the SPX in this period by leveraging the alpha in the stock selections, but as anticipated the portfolio is mostly driven by the market’s results.
Long-Bias Reduced Market Risk with Higher Specific Risk
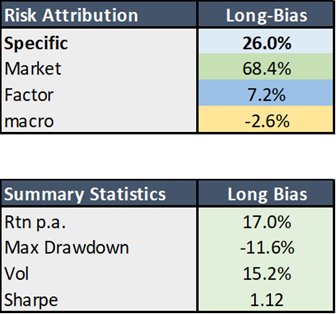
Our Risk Attribution shows that the Long-Bias portfolio is still predominantly driven by market risk even though the portfolio has only 50% net long exposure.
However, this portfolio delivers much higher specific risk – from 5.5% up to 26%!
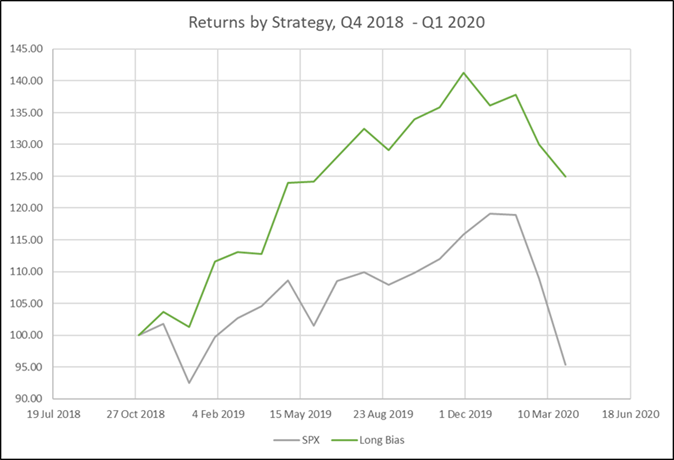
The shape of the returns still look like the SPX – again consistent with the Risk Attribution. But they do not track nearly as closely as the 130/30 and the portfolio has much lower volatility and drawdown.
Again, this portfolio performs as it says it should “on the box” – market-like exposure enhanced by the alpha from the stock picks but with lower risk than the market.
Cash Neutral Delivered A Mix of Non-Market Risks
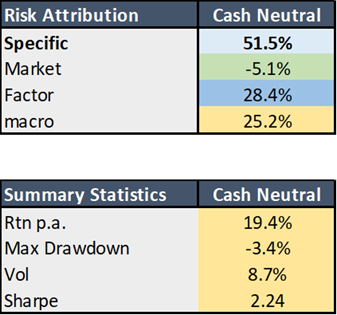
The Cash Neutral portfolio results start to get interesting. While the portfolio has little market risk, Factor and Macro risks still appear to explain half of the portfolio’s risk.
At this point most of the Risk is being driven by stock selection – 51.5% from the Attribution.
This type of result is what most PMs end up producing on their own in a market neutral book. Extremely low market beta, meaningful specific risk driving performance, but also sizable residual bets – whether intentional or unintentional!
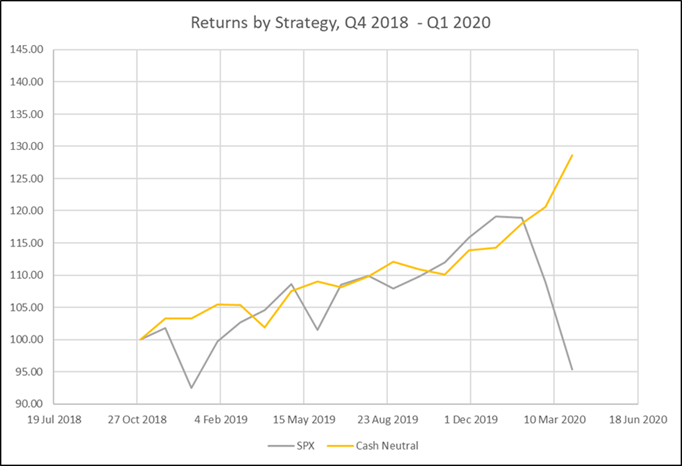
As a result, the returns bear little resemblance to the SPX. The volatility and drawdown are much lower than the portfolios with a net long equity exposure.
Factor Neutral Driven Almost Exclusively by Specific Risk
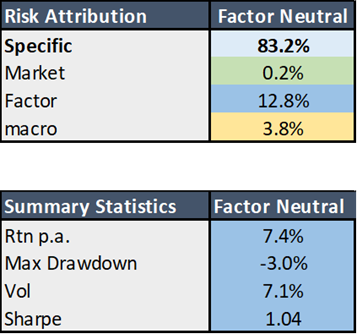
Taking this process one step further, the Factor Neutral portfolio shows very little market risk as well as very low residual risk. The stock-specific risk is 83.2%!
This portfolio really isolates the stock selection alpha – which is ultimately what institutional allocators want from a traditional equity long/short manager.
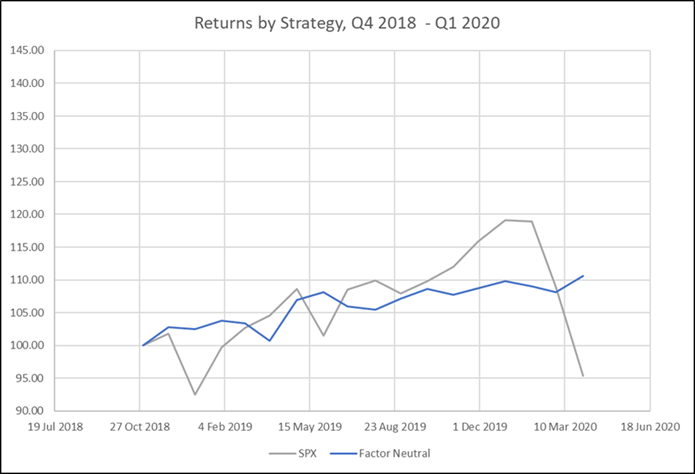
The Factor Neutral portfolio shows very low risk given the total lack of equity or macro factor volatility. The returns at this point bear no resemblance to the SPX.
Each Long/Short Equity Portfolio Delivered Appropriate, Risk
Each of these portfolios delivers dramatically different types of risk, whether it be market risk, factor risk or stock-specific risk. At the same time, all four portfolios express the alpha in the underlying stock selections.
When the portfolios are well-constructed, the PM can ensure the risk driving the portfolio is consistent ex-ante with the requirements of the strategy they’ve sold their investors.
From a risk standpoint, every one of the portfolios delivered the desired type and range of risk as we discussed above.
Which Experience is What You’ve Sold Your Investors?
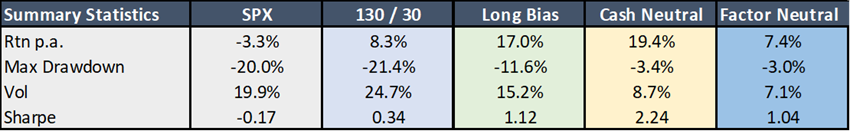
- 130/30 delivered SPX-like drawdown and volatility with enhanced performance
- Long-biased delivered alpha exposure with half the drawdown and lower vol
- Cash neutral delivered alpha exposure with risk largely unrelated to SPX
- Factor neutral delivered alpha exposure with the lowest vol and drawdown
Any of these results would be fine, if that’s what your Investors want!
One Portfolio’s Results look a Bit Different… Why?
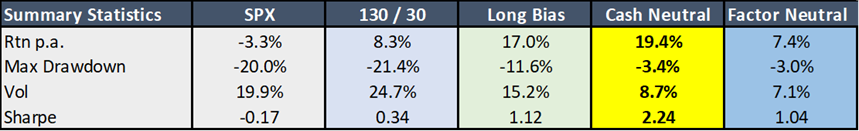
Looking at the realized results of each strategy, one portfolio is a bit of an outlier in terms of its returns and risk-adjusted returns (Sharpe). The Cash Neutral portfolio produced noticeably different results from the same alpha source as the other portfolios.
Looking at the Risk Attribution, Cash Neutral retained significant residual Factor and Macro risks when compared with the other portfolios.
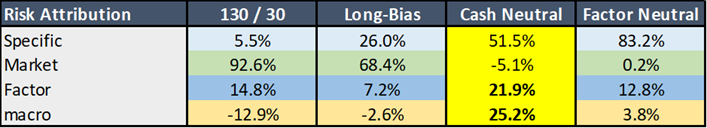
Half of portfolio risk was driven by Factor and Macro risks – which clearly drove substantial outperformance compared with the other strategies!
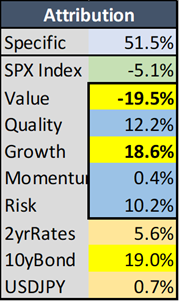
A full breakdown of the style factors and macro factors used in the risk attribution shows clear factor tilts – a consistent tilt on growth v value, as well as exposure to 10 year yield.
Could we have anticipated these residual risk bets ex-ante?
Cash Neutral had Clear Factor Tilts in Construction
Revisiting the Ex-Ante risk from earlier, we can see that the portfolio has a consistent tilt against the Value Factor during the full period and in Q1 ‘20 a tilt towards the Growth Factor. The portfolio was also consistently long Bonds!
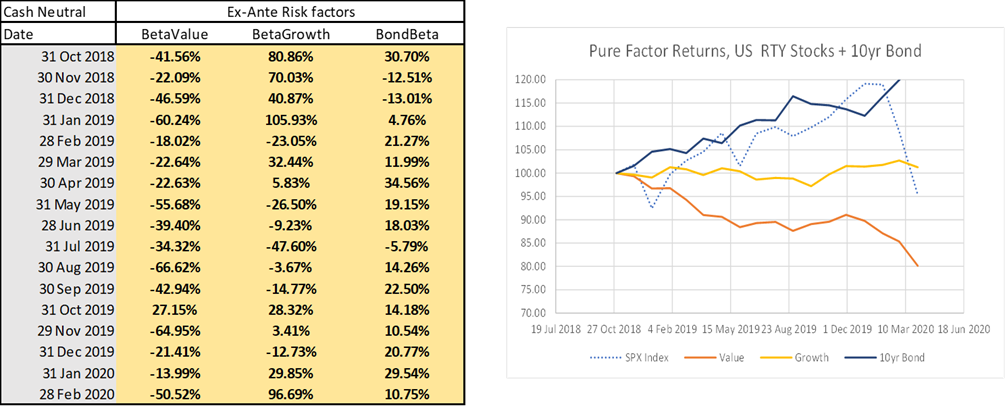
The Cash Neutral portfolio raises important questions for a PM to consider… are bets like this an unintentional fluke in ‘factor terms’, or was it deliberate? Did the selection alpha happen to be in the stocks that had those factors or does your single stock alpha have a persistent bias?
In an example like this with substantial residual factor risk, the PM has three real choices:
- Neutralise the factor risk
- Ignore it and accept the residual factor exposure
- Set explicit factor overlays in the portfolio
Any of these choices are fine, but again they should be consistent with:
- How you generate your stock selections
- How you have told your investors you will act.
If your investors want maximal specific risk they might be unpleasantly surprised if your returns are largely driven by a growth vs value bet.
Finetune to Deliver the Right Level of Risk
Once you have ensured your portfolio is constructed to deliver the right TYPE of risk and in generally the right RANGE to meet investor requirements, PMs can use portfolio construction techniques to finetune the LEVEL of risk they want to take.
In practice building tightly factor neutralized portfolios and targeting specific levels of risk generally require quantitative portfolio construction methods. While a PM might get close adjusting positions by themselves getting the sizing right across the book is an exceedingly difficult problem.
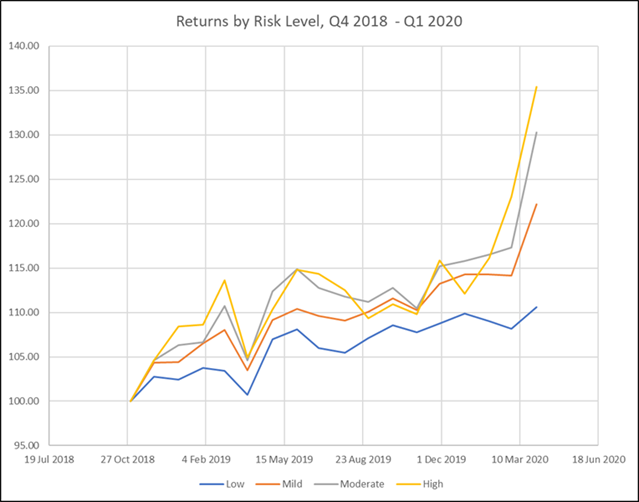
All four portfolios below are Factor Neutral, consistent with the requirements and risk profile of the 4th example above.

However, each portfolio represents a different degree of risk tolerance the PM can choose. As we scale from Low Risk to High Risk each portfolio shows corresponding expectations of greater drawdown and volatility.
Does Your Long/Short Equity Portfolio Construction Deliver the Risk You Want?
Leading fund managers construct their long/short equity portfolio with intentional answers to these questions that are consistent with your investor requirements. Delivering the risk your investors want ensures alignment of goals and makes for stickier assets in a competitive space.
- What Risk(s) Do I Want to Take?
- How Much Risk Do I Want to Take?
- How Should I Construct My Book to Meet Those Objectives?
Sherpa has extensive experience helping PMs navigate these questions to construct long/short equity portfolios that take the RIGHT risks.
Other Process Alpha posts will go into more detail on how to use quantitative portfolio construction methods to target specific levels of risk.
To see the potential impact of improved portfolio construction on your portfolio and learn more about refining your team’s portfolio construction process, get in touch with the Sherpa team or sign up for the SFT mailing list here.